RESEARCH
Analysis of Large US University Endowment Outperformance – November 2025 Update

This paper is an update two years on from our whitepaper entitled “Analysis of Large US University Endowment Outperformance” covering the 10-year period ending June 2023 of a select group of 12 US university endowments. This update covers the 10-year period ending June 2025. We have made one small change to the methodology and that is to report portfolio performance net of endowment internal investment team costs. Our past reports have not ensured these were reported on an “apples to apples” basis. This has been corrected in both 10-year periods (ending 2023 and 2025).
US Endowment absolute performance for 10 years ending June 2025
The average 10-year performance for the 12 has dropped from 9.8% p.a. through June 2023 to 9.2% through June 2025, largely reflecting weak private equity performance in the last two years compared to that of 2014-15 which has dropped off the time series. In the 10-year period to 2023, Large endowments (defined as having a 2025 AUM >$25B) returned 10.0% compared to 9.6% for Medium endowments. By the 10-year period to 2025, this gap had closed, with both groups averaging 9.2%.
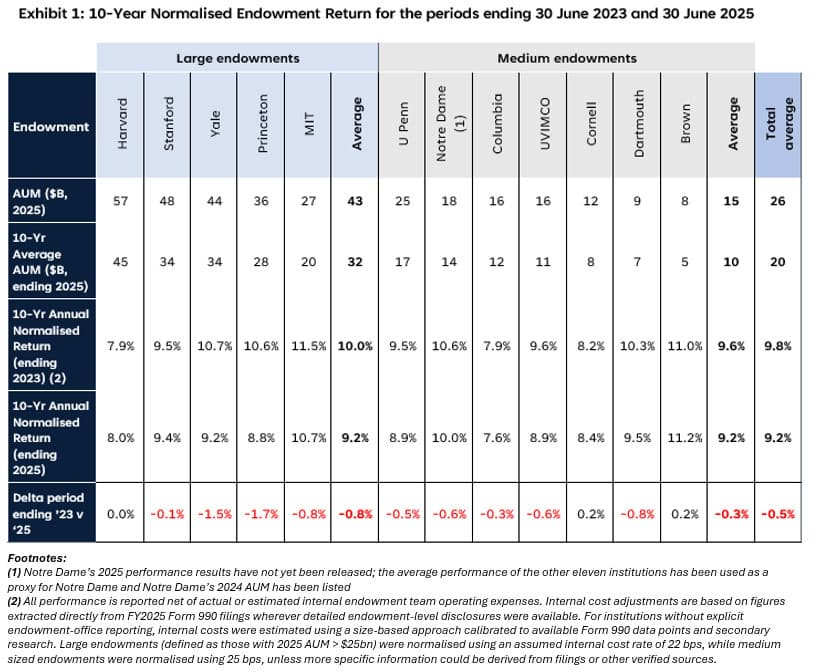
Over the ten-year period to June 2025, Brown was the highest performer at 11.2%, standing 3.6% ahead of the lowest performer (7.6%). Brown, Cornell, and Harvard were noted for maintaining or marginally improving their absolute performance, while the group saw a largest single decline of a 1.7% reduction in 10-year average absolute returns.
Risk-adjusted or relative performance
The analysis uses two passive benchmarks to assess risk-adjusted or relative performance. The investible equity + cash benchmark for the 10-years ending June 2023 showed that across the 12 portfolios over the 10 years, there was a 71.5% average equity-like risk generating a 7.3% equity+cash return on average compared to 74.6% equity like risk and an 8.7% equity+cash return for the 10-years ending June 2025. The result of a slightly declining absolute average return from 9.8% to 9.2%, while the benchmark rose from 7.3% to 8.7%, translates into an alpha reduction from 2.5% to 0.5% for the 12 endowments on average.
The second, less investible, asset-allocation based benchmark is composed of the blended performance of relevant asset class indices, weighted by the endowment’s average asset allocation over the prior 10 years. This methodology removes the impact of receiving (or paying) an illiquidity premium, as it credits teams only for returns generated in excess of the average performance of each asset class. The average asset-allocation based benchmark performance was 8.8% for the 10-years ending June 2023 vs 8.1% for the 10-years ending June 2025, a drop largely related to the drop in private equity performance in the last two years. The resulting alpha changed very little as a result, with 1.0% for the period ending in 2023 and 1.1% alpha for the period ending 2025. The strongest performer (Endowment C) achieved an asset allocation alpha of 3.4% over the 10-year period to 2025, an improvement of 1.1% since 2023. In contrast, the weakest endowment (Endowment K) recorded an alpha of 0.0%, leading the spread between the strongest and weakest alpha generators to widen from 2.8% in 2023 to 3.4% in 2025.